One of the most exciting parts of science is communicating your findings to an unexpecting audience. Shock ’em with pizzazz.
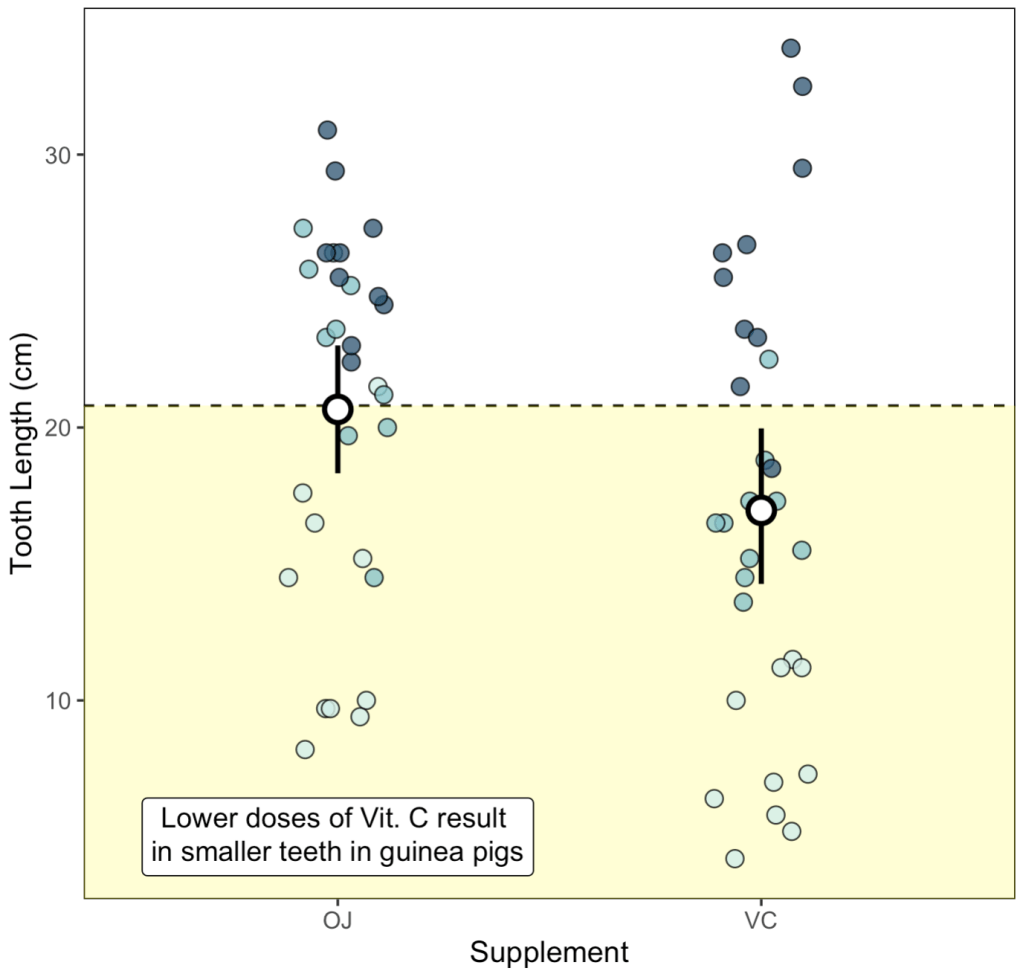
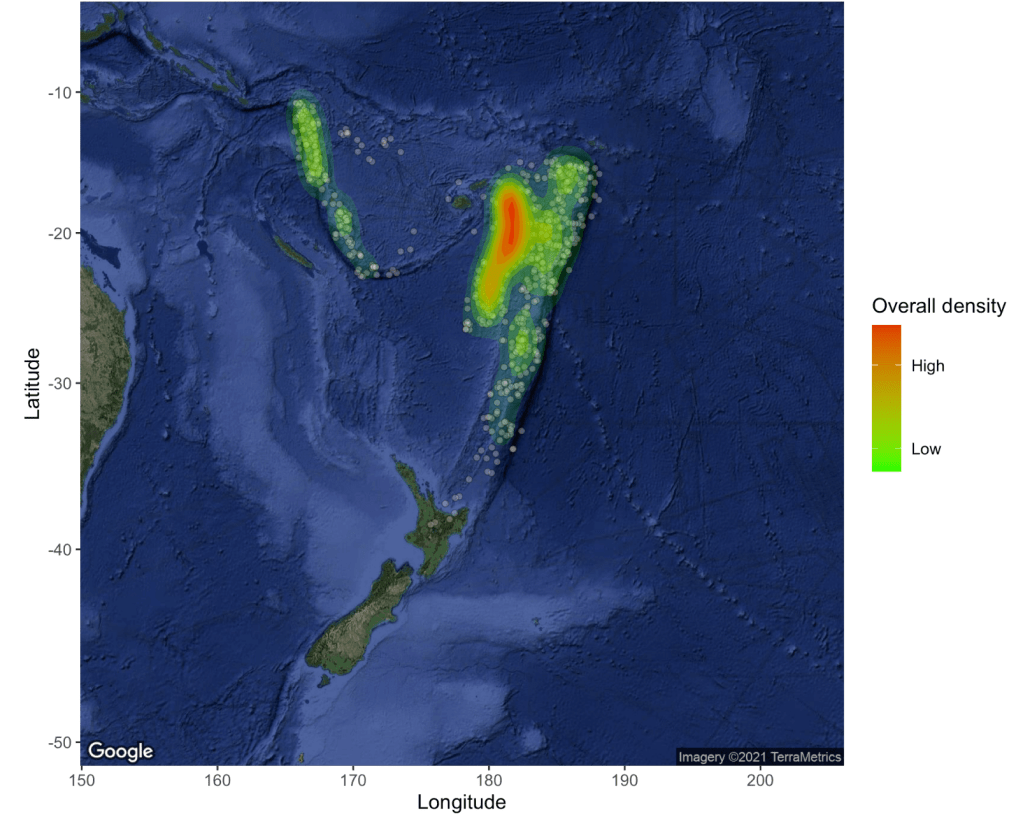
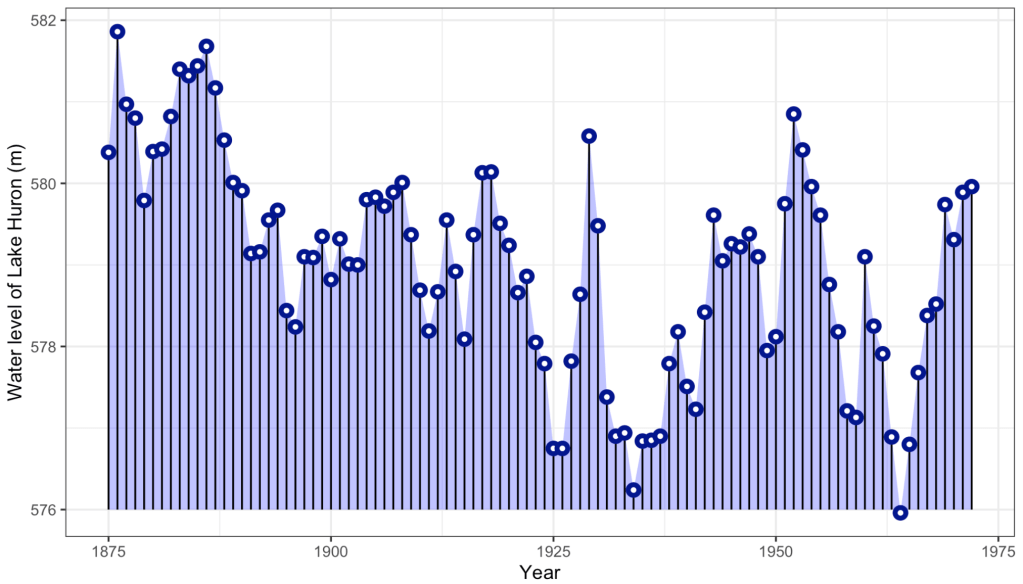
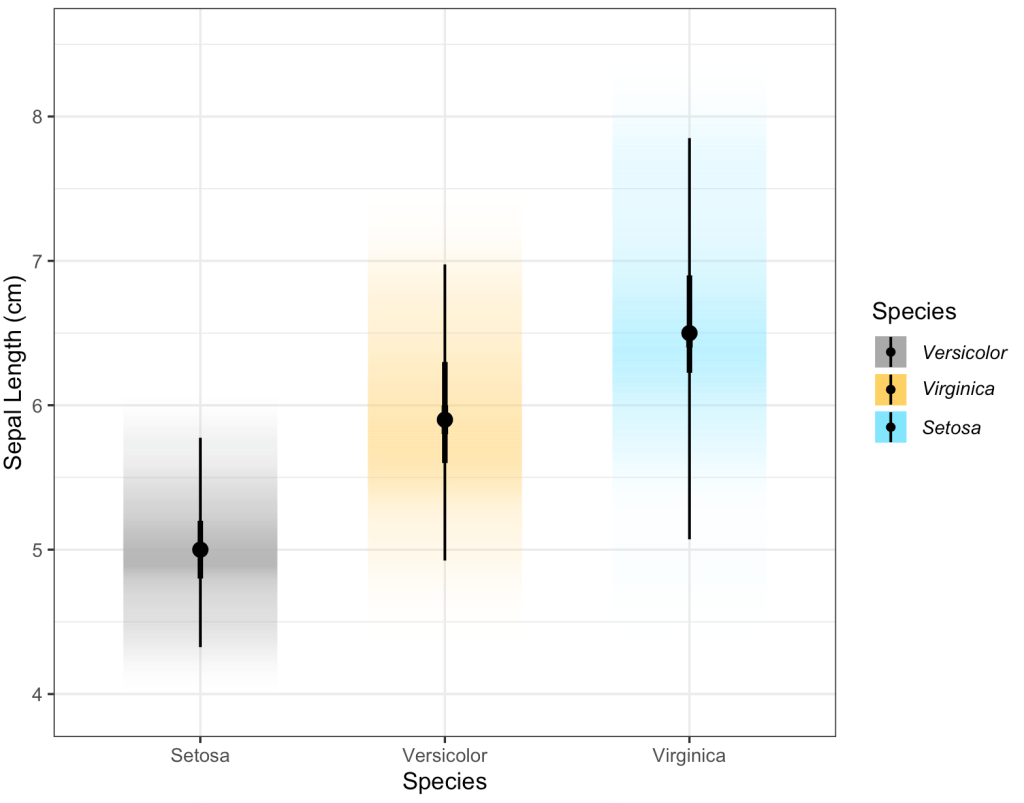
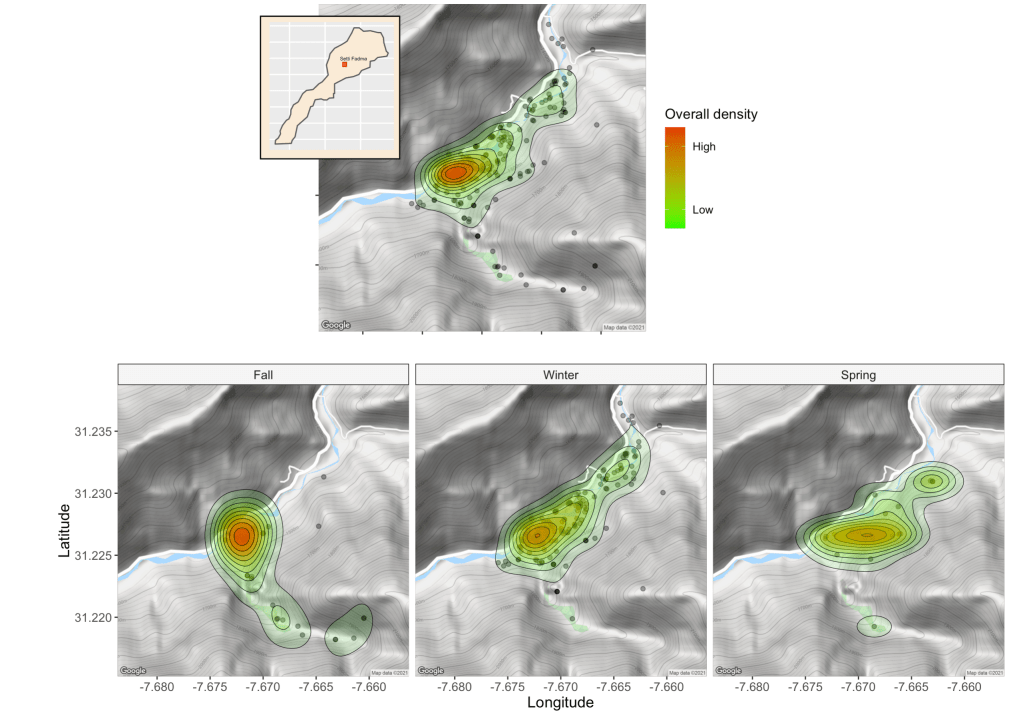
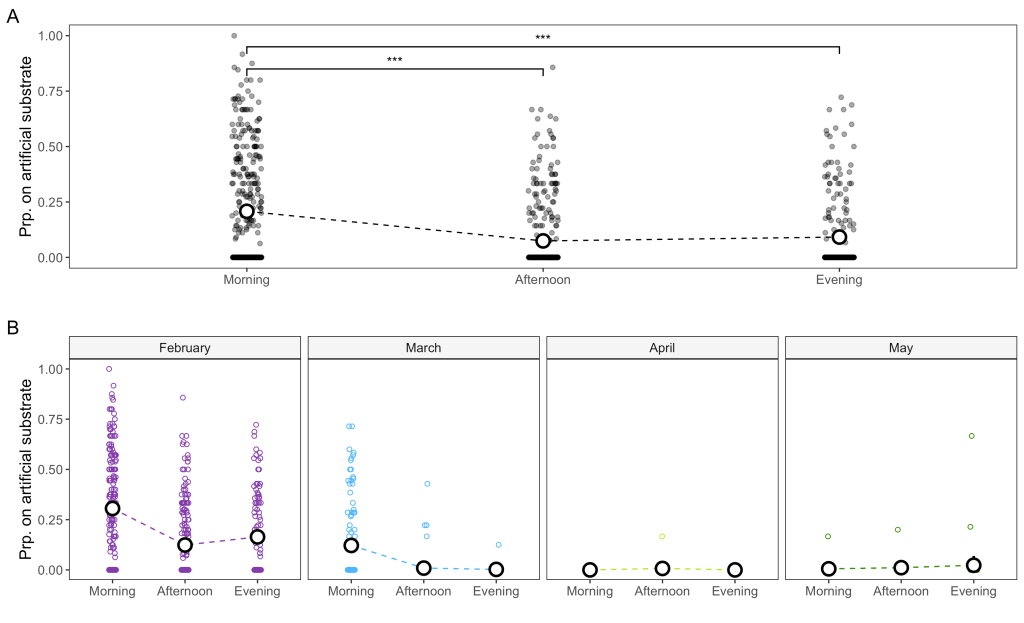
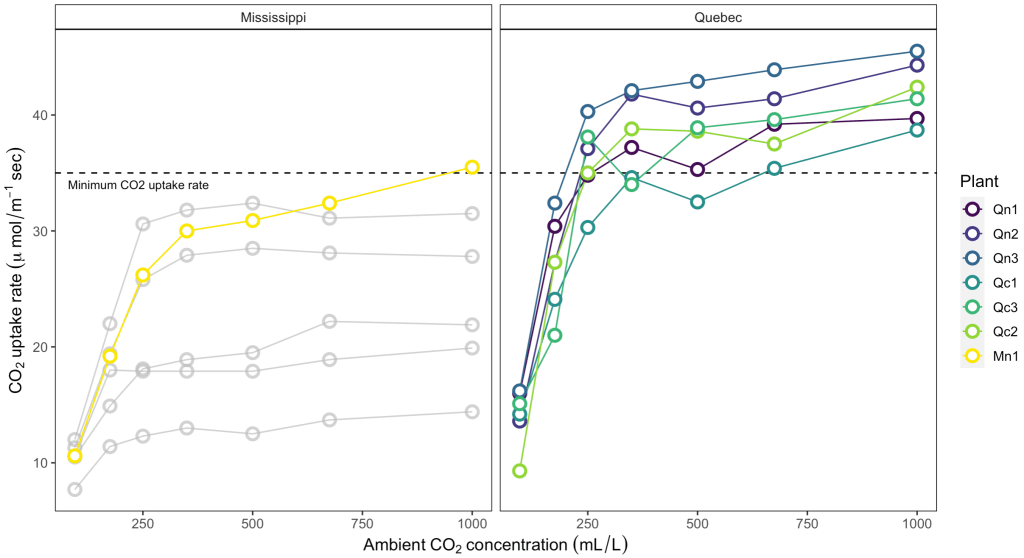
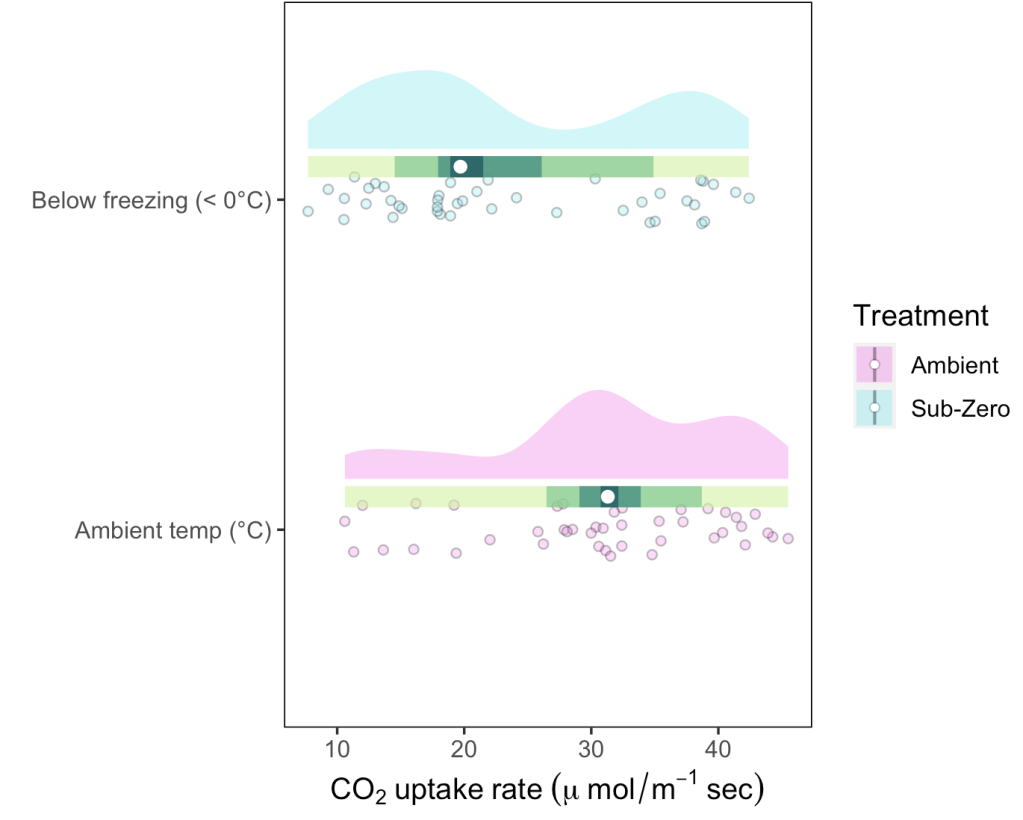
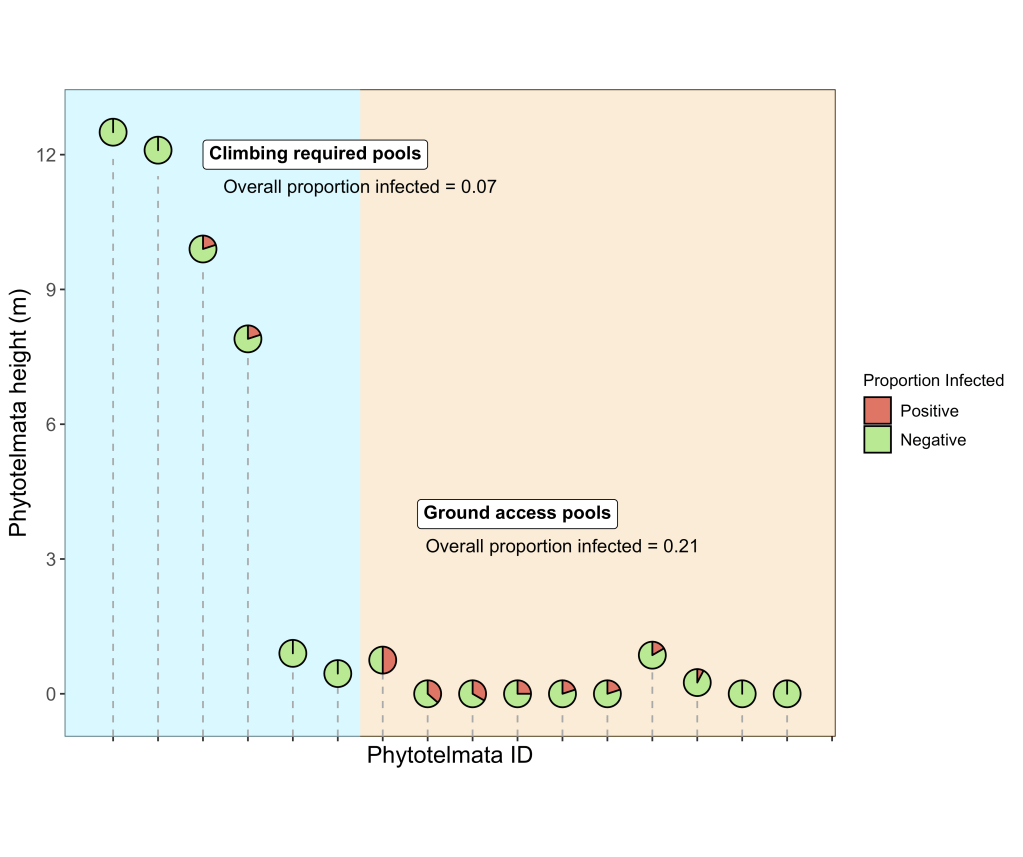
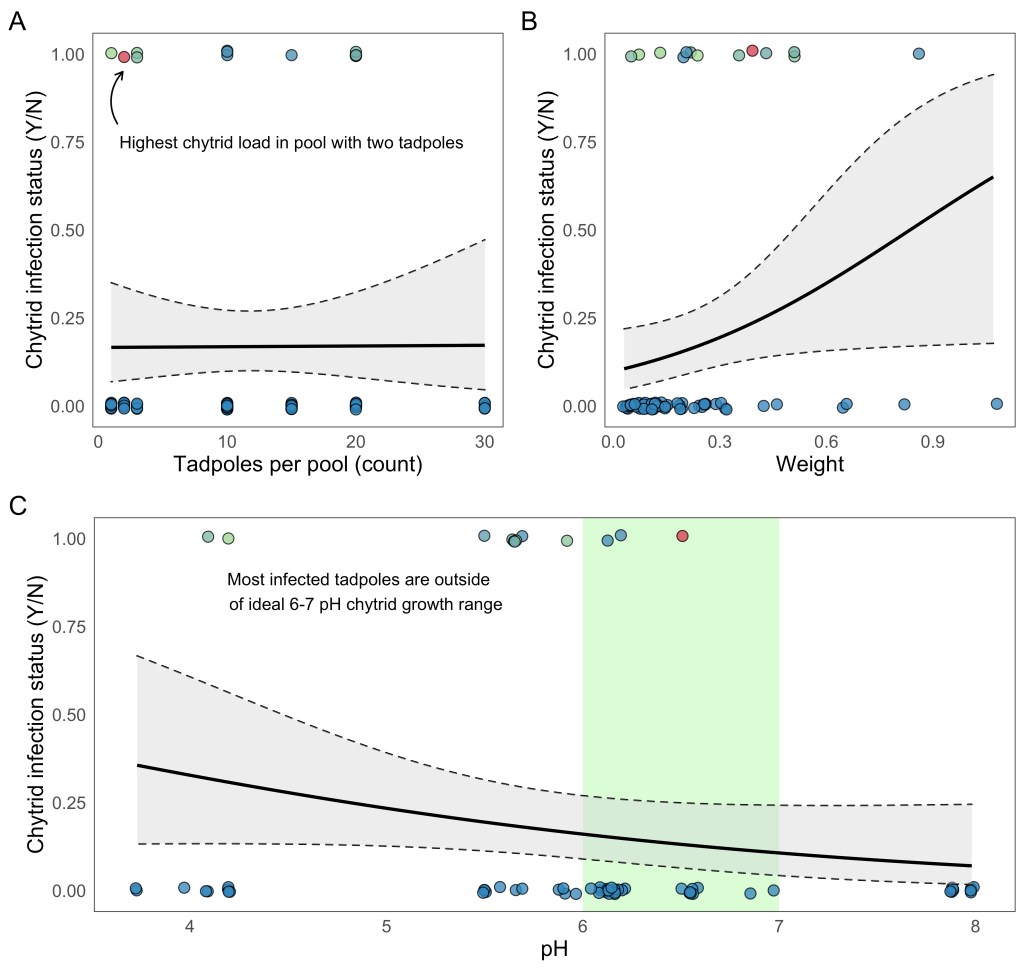
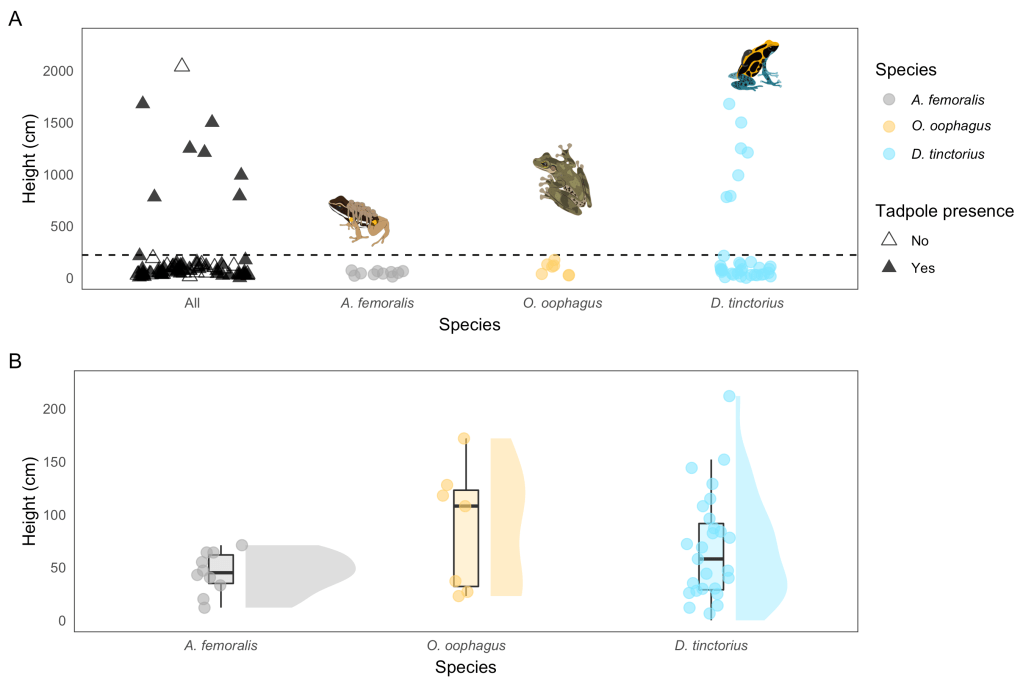
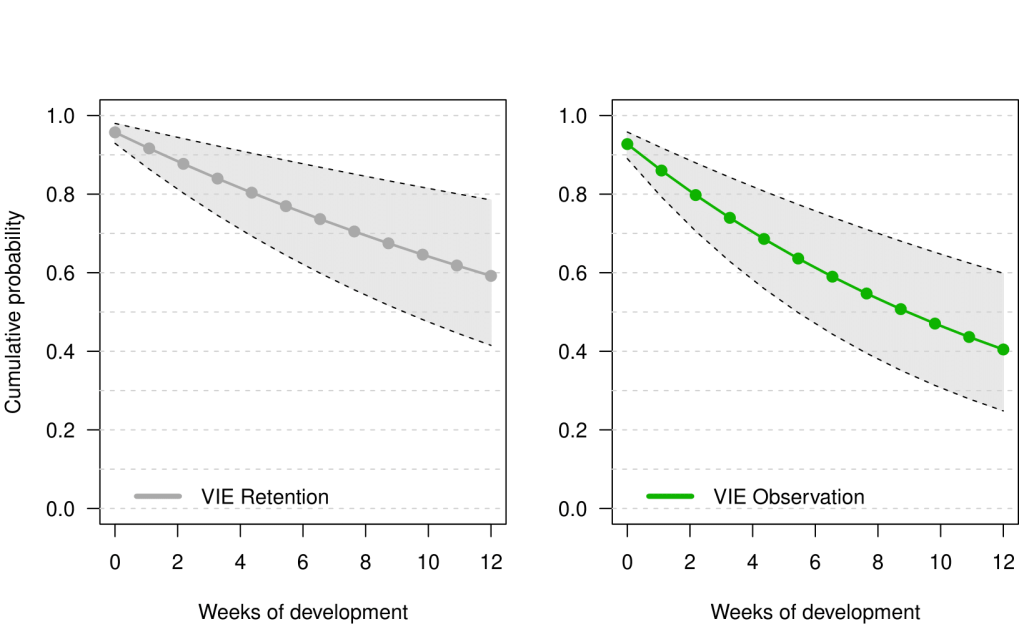
Visualisations below are either currently published from manuscripts authored by CAF, or are exercises from publicly available data sets created for either teaching purposes or the sheer glee of just making a good lookin’ plot.
All graphs, composite figures, illustrations, vectors, and videos designed by CAF except when otherwise attributed.
If you wish to see a more diverse coding sample of my work that is currently in progress/in press, please contact me directly
Youtube coding tutorials
Graphical Abstracts || Logos


See my design process for the 2026 ESA Disease Ecology Section Logo
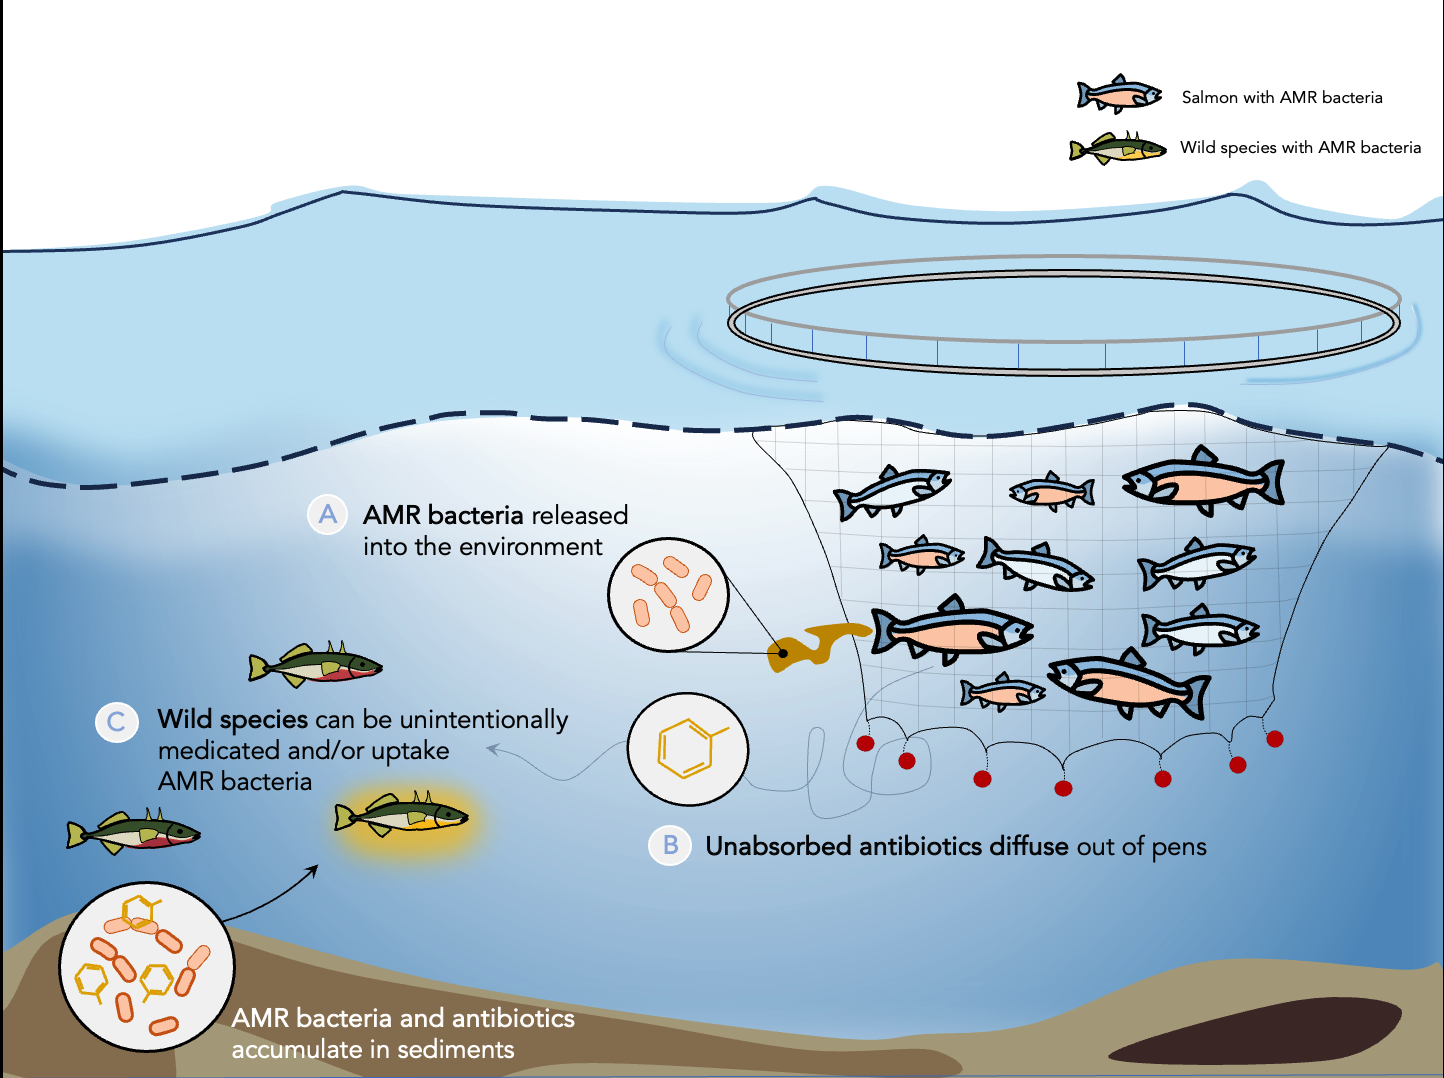
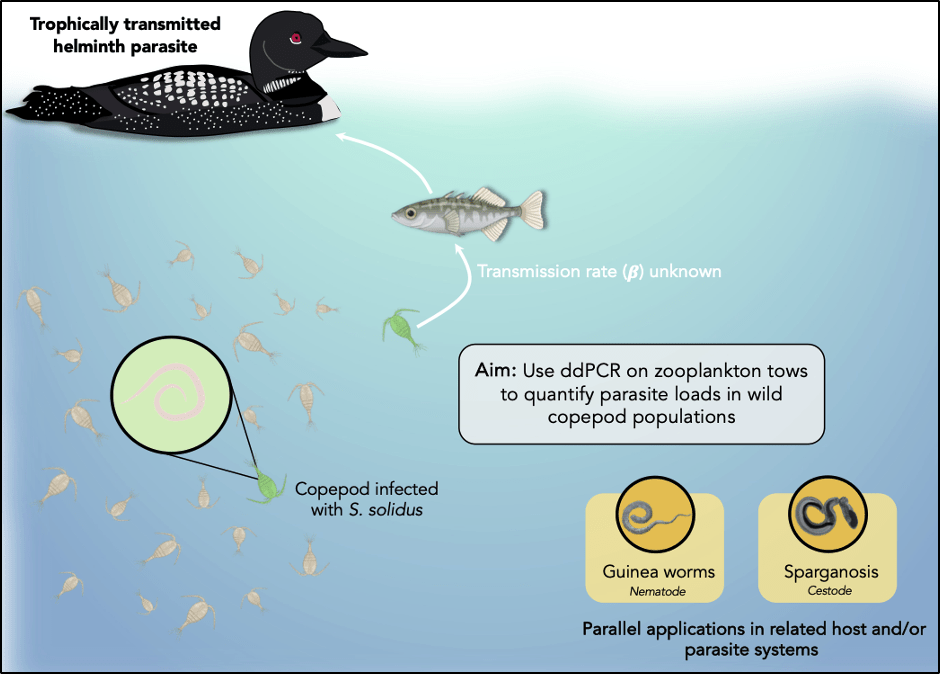
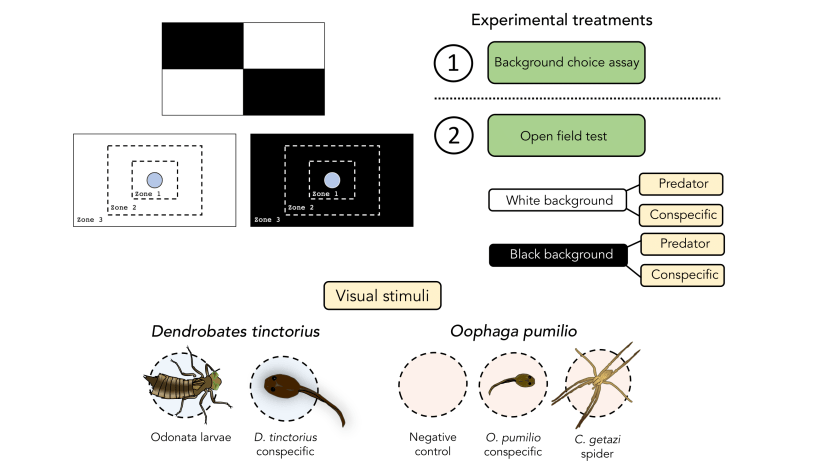

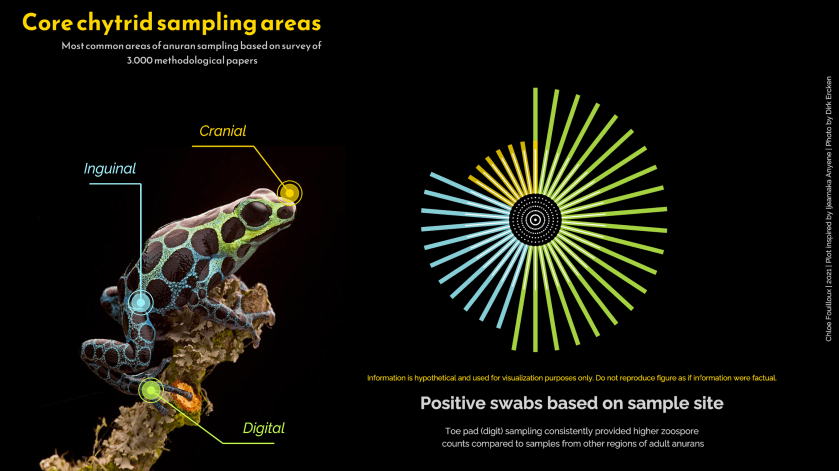

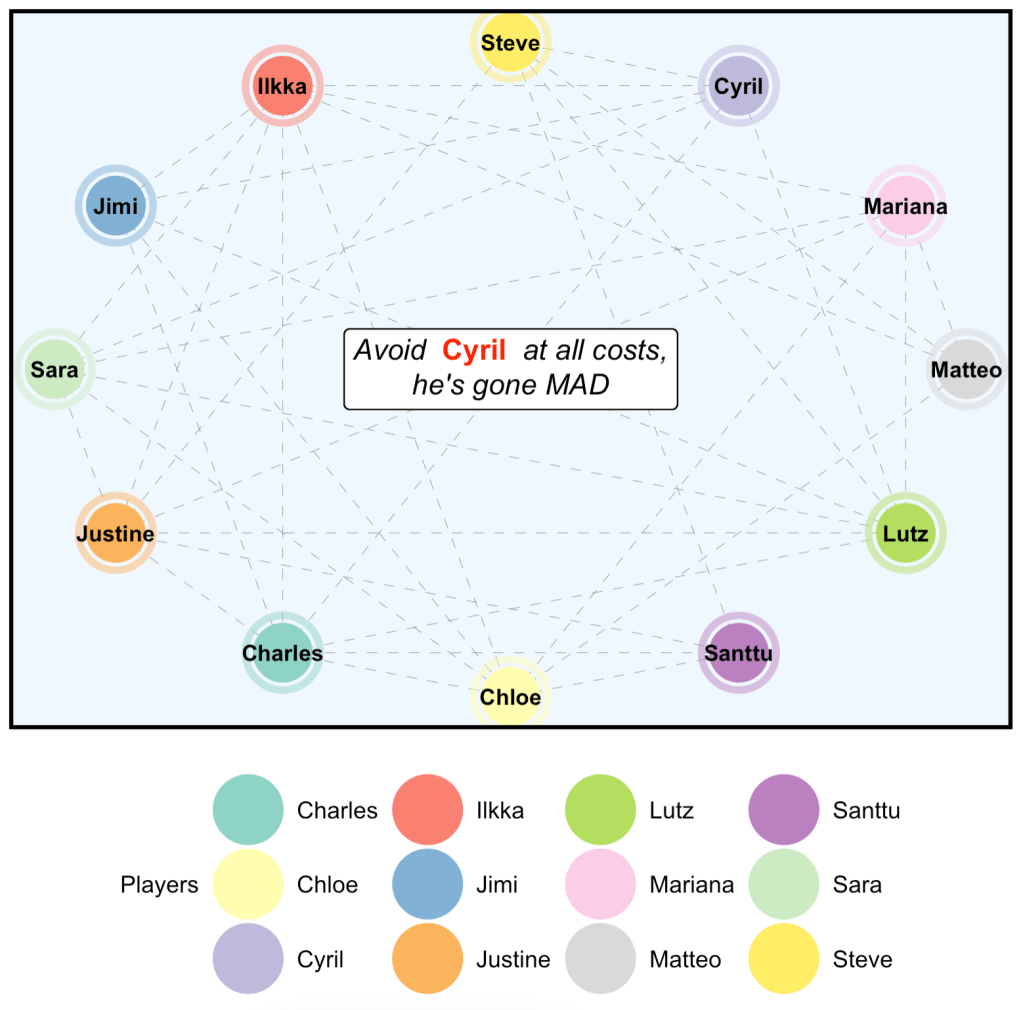
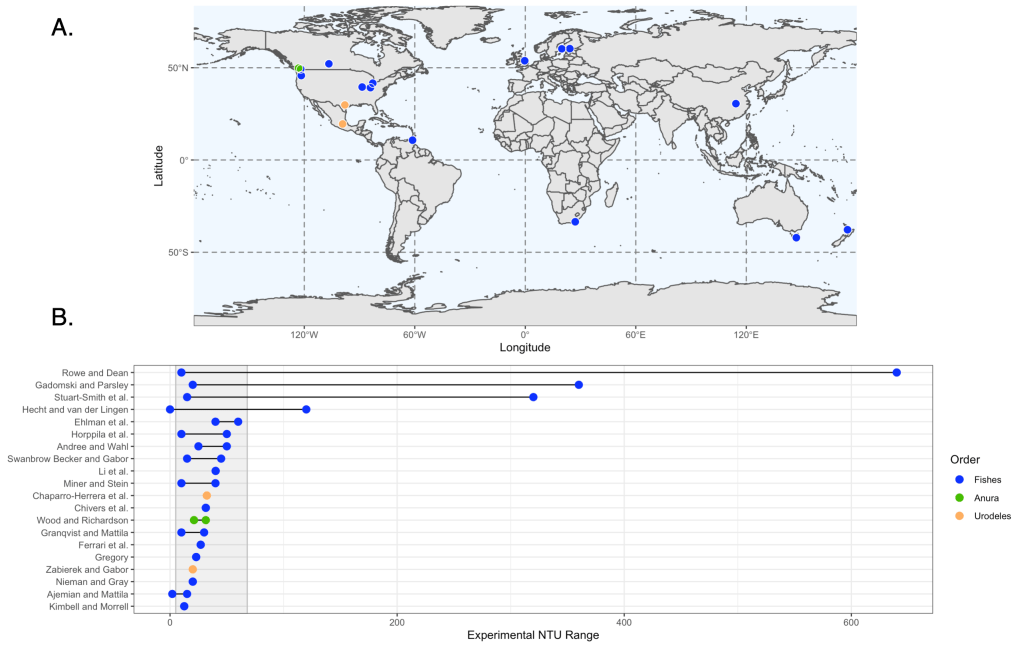
Figures || Maps || Networks

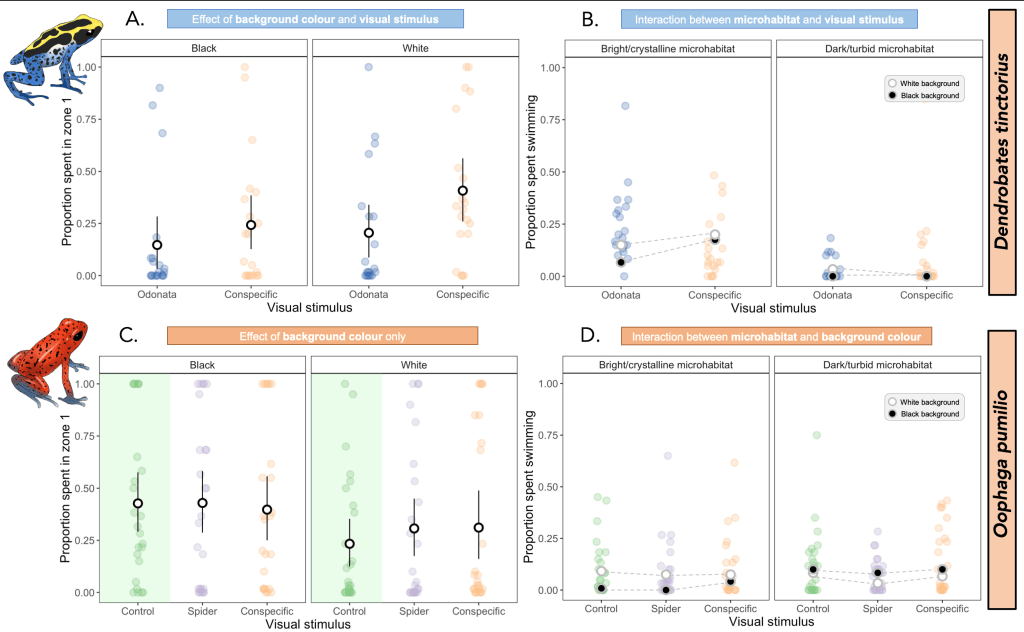
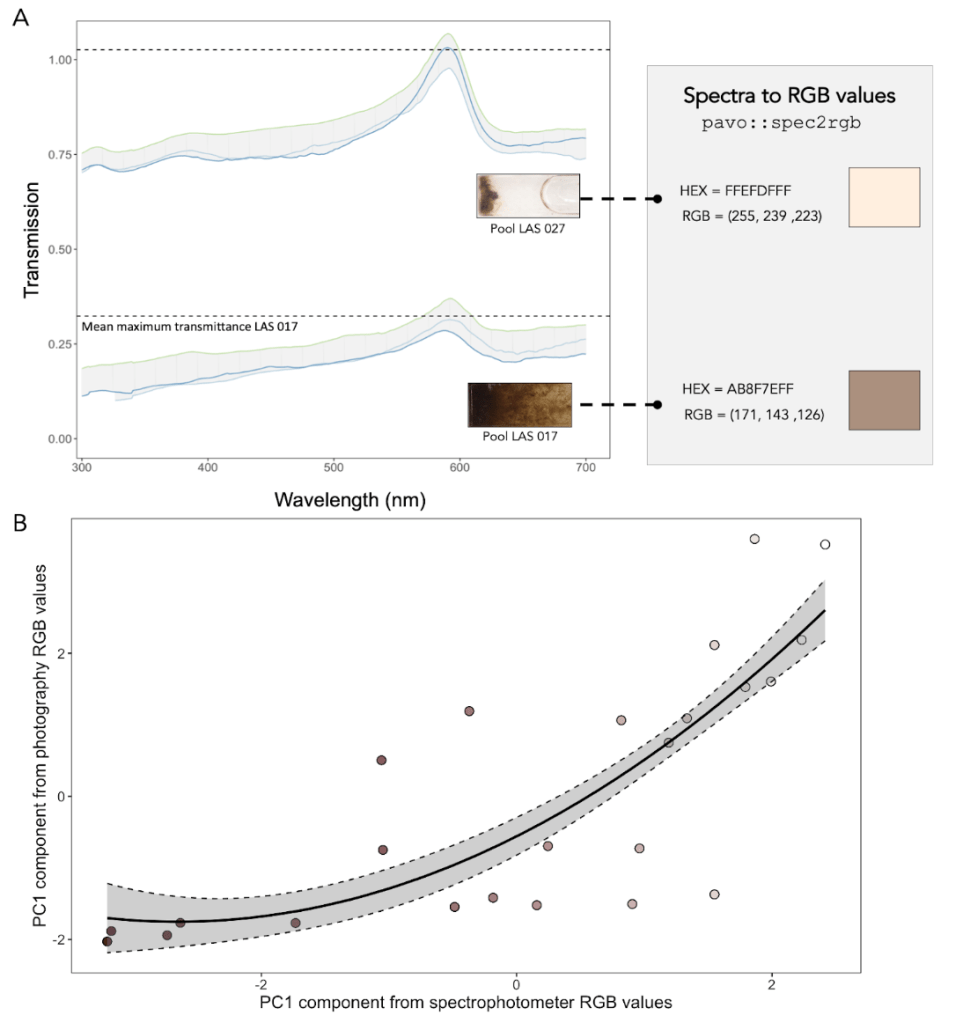
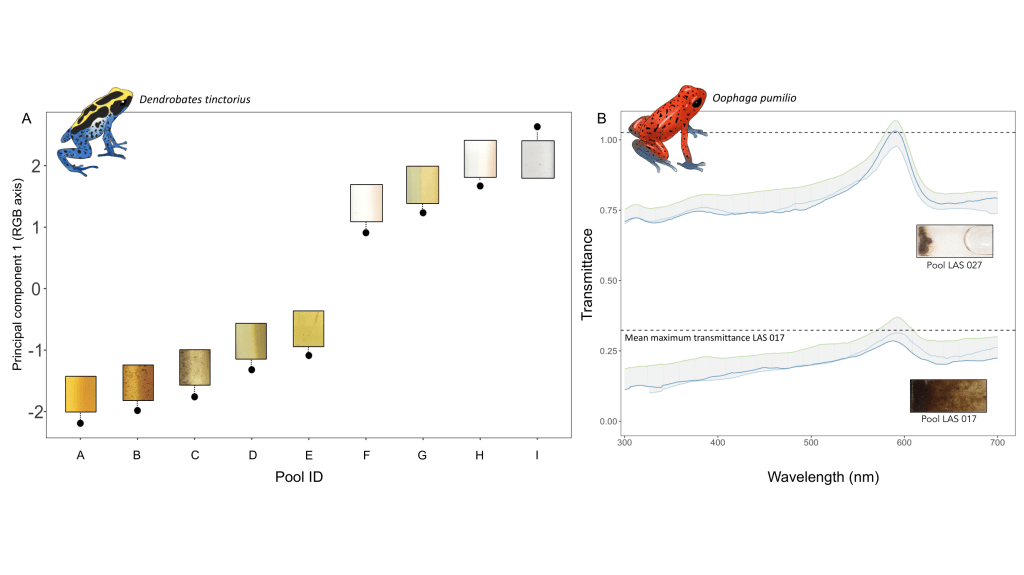

Scientific poster redesign
All adult poison frog illustrations have been used with the kind permission of either Andrius Pašukonis or Lia Schlippe Justicia.

